
Comments on IMF’s “Global Trade: What’s behind the Slowdown?” – or why there is more to trade slowdown than weak demand
The IMF’s latest World Economic Outlook points to weak demand and investment as the main factor behind the world trade slowdown. I argue that this conclusion is overblown and that the high-quality underlying work falls well short of explaining the slow trade puzzle.
By Sébastien Jean
The analysis of world trade slowdown delivered by the IMF in its latest WEO (Chapter 2) is an important contribution, based on substantial and skillful quantitative analysis. It concludes that “the overall weakness in economic activity, in particular in investment, has been the primary restraint on trade growth, accounting for up to three-fourths of the slowdown”. While other factors widely held as key explanations for slow trade are also mentioned (rebalancing of China’s economy, changing dynamics in GVC participation and increasing spread of protectionism), the emphasis put on weak demand as the main underlying cause has important implications: if most of the slowdown is due to weak demand, then there is no point in questioning a potential structural break in GVC participation or the rise in protectionism; in addition, trade should be expected to follow more or less its pre-crisis trend in the future, at least when adjusted for weaker GDP and investment growth. As this diagnosis is not shared by all analysts, though, a critical assessment is in order.
Three different methodologies are combined in this analysis: an aggregate import demand model, a theory-based structural decomposition analysis, and gravity estimates. In practice, however, only the first one really supports the conclusion. The second one, while being an elaborate piece of research, remains a rather stylized representation of reality, based on a schematic interpretation of changes in relative prices under the assumption of homogenous products. It does not attempt to explain changes, since the model is by construction calibrated to reflect the different states of the world economy. Instead, it allows attributing changes to two different factors, one being an indirect assessment of trade costs, while the other is a wide-ranging definition of changes in demand structures. As such, these results are difficult to interpret in a policy perspective. As for the third methodology, based on gravity estimates, it does not point to demand factors, but rather to the importance of GVC participation, identified as having been a booster of world trade before the financial crisis, but not since then.
As matter of fact, the conclusion thus relies on estimations of an aggregate import demand, adjusting for the import-intensity of its different components. The main result is summarized in the first panel of the report’s Figure 2.7 (p. 73, reproduced in Figure 1 below). The claim that “changes in economic activity can account for about three-fourths of the decline in the global goods import growth rate” is mainly based upon result B on the right-hand side of the graph, showing that the model only leaves approximately 1.7 p.p. unexplained (the red bar) out of a total slowdown of 6.5 p.p. The latter figure is intriguing, to begin with: did trade really slowed down by as much as 6.5 p.p.? Should we really expect world trade to increase yearly by close to 10%, instead of the rhythm close to 3% observed in recent years? Two important reasons are behind this unrealistically high target. The first one is related to the choice of the reference period. 2003-2007, the period chosen due to data constraints, was a bully period for world trade, just after the 2001-02 trough and just before the 2008-09 fall. By any standard, this is not a suitable benchmark for a long-term analysis. 1985-2007 is clearly preferable in this respect, and Figure 1 left-hand panel shows the difference it makes: the model then leaves approximately 2 p.p. unexplained, out of a slowdown worth less than 6 p.p. The second reason has to do with the definition of the slow growth puzzle. Nobody denies the fact that slower GDP growth leads to slower trade growth, so the puzzle is not that trade has slowed down, but rather that it slowed down more strongly than GDP did. In other words, what needs to be explained is not the growth in world trade in absolute, but rather relative to GDP. Simple calculations based on the WEO database allow assessing the joint implications of these two remarks (Table 1): using the 2003-07 period as a benchmark and trade growth as the variable of interest, the slowdown is 5.8 p.p. (slightly less than in the IMF model, presumably due to sampling differences); using instead the 1985-2007 period and focusing on the differential growth rate of trade with respect to GDP, the slowdown is reduced to 3.0 p.p. This is still large, but provides a different perspective: the 2 p.p. unpredicted world trade slowdown in IMF estimates are not a quarter anymore, but rather two-thirds of the puzzle. Explaining a third of the slowdown is not that bad already, but might warrant more humble conclusions -in line, by the way, with the fact that all but one of the twice-yearly IMF forecasts of world trade volume proved overestimated since 2011, often by a large amount.
The IMF interpretation more specifically points to the role of investment, a relatively import-intensive component of demand. In particular, it emphasizes that “the sharper slowdown of trade in capital and durable consumption goods (…), which is a large part of investment expenditures, points to the potential role of investment weakness in holding back global trade growth in recent years” (IMF 2016, p. 69). This argument is best illustrated by the report’s Figure 2.4, Panel 4 (p. 70, reproduced below as Figure 2). Two remarks are in order here. Firstly, trade in capital goods was actually the most dynamic component of world trade over the recent period. It is thus paradoxical to point out its role in order to explain the slowdown, even though more sustained growth might certainly have been expected for this component. Secondly, as already mentioned, the 2003-2007 period is not representative because it is clearly an above-trend short spell. This is especially clear here, since the average yearly growth rate of world trade in volume was 14% for capital goods over that period –meaning approximately a doubling every five years. Is this really a sustainable trend, which can be meaningfully used as a benchmark? I doubt it.
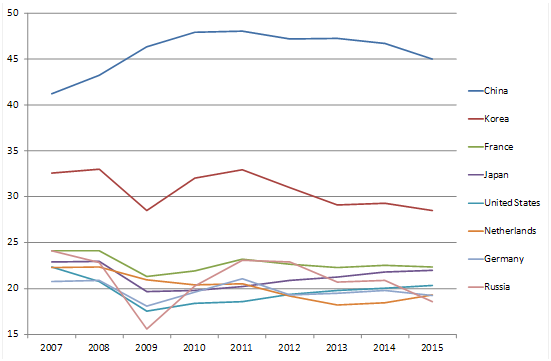
So, what was really the role of investment weakness in the recent trade slowdown? Being more import intensive than other components of demand, investment might indeed drive down world trade growth as long as its growth rate is lower than the one of other demand components. Put differently, this may be the case when the share of investment in GDP is declining –whatever its level. Was it the case over the recent years? Based on the WEO database and focusing on top exporters, the picture is not clearcut (Figure 3): the decline in investment was clear in China (as expected from the on-going rebalancing process), it was also significant in Korea (also starting from a very high level in this country), and Russia shared this trend in 2015 as a result of its economic crisis. Other countries, in contrast, did not experience a downward trend in investment as a share of GDP since 2011. This does not mean that investment level is satisfactory: on the contrary, it did not recover its pre-crisis level in any of these big countries, a fact that is a major concern for growth and the root of the secular stagnation debate. While investment level is low, though, its growth rate in recent years has been more or less on a par with other demand components. In this rebound phase, investment should be more dynamic and act as a booster of trade. However, arithmetically, as long as it does not grow significantly less rapidly than the rest of demand, investment cannot be an important explanation for the recent trade slowdown (notwithstanding the fact that it was clearly one of the main explanations for the sharp fall of trade during the crisis, in 2009).
Two conclusions follow. Firstly, the IMF assessment overemphasizes the role of weak demand, and in particular investment, in explaining the trade slowdown. Of course, slower GDP growth command slower trade growth, this mechanical relationship cannot explain recent trends. The flipside is that the IMF assessment probably understates the importance of the other main factors, put forward in several other studies: the rebalancing of the Chinese economy, the declining dynamism in GVC participation, and the spread of protectionist policies (see, e.g., Constantinescu et al. 2016, Crozet et al. 2015, Haugh et al. 2016, or Evenett and Fritz, 2016). Secondly, the estimates presented barely explain a third of the world trade slowdown. This should humble us about how well we understand on-going trends, and our humility in this respect should be reinforced by the most recent figures: as mentioned by the IMF, high-frequency data assembled by the Netherlands CPB suggest that world trade in volume actually stagnated, or better said slightly declined, since early 2015. Decidedly, there is more to world trade’s recent trends than weak demand and investment.
This post was written based on the author’s discussion of WEO’s Chapter 2 the seminar “IMF insights on slow trade and global disinflation”, organized by CEPII on 12 October 2016 in Paris.Three different methodologies are combined in this analysis: an aggregate import demand model, a theory-based structural decomposition analysis, and gravity estimates. In practice, however, only the first one really supports the conclusion. The second one, while being an elaborate piece of research, remains a rather stylized representation of reality, based on a schematic interpretation of changes in relative prices under the assumption of homogenous products. It does not attempt to explain changes, since the model is by construction calibrated to reflect the different states of the world economy. Instead, it allows attributing changes to two different factors, one being an indirect assessment of trade costs, while the other is a wide-ranging definition of changes in demand structures. As such, these results are difficult to interpret in a policy perspective. As for the third methodology, based on gravity estimates, it does not point to demand factors, but rather to the importance of GVC participation, identified as having been a booster of world trade before the financial crisis, but not since then.
As matter of fact, the conclusion thus relies on estimations of an aggregate import demand, adjusting for the import-intensity of its different components. The main result is summarized in the first panel of the report’s Figure 2.7 (p. 73, reproduced in Figure 1 below). The claim that “changes in economic activity can account for about three-fourths of the decline in the global goods import growth rate” is mainly based upon result B on the right-hand side of the graph, showing that the model only leaves approximately 1.7 p.p. unexplained (the red bar) out of a total slowdown of 6.5 p.p. The latter figure is intriguing, to begin with: did trade really slowed down by as much as 6.5 p.p.? Should we really expect world trade to increase yearly by close to 10%, instead of the rhythm close to 3% observed in recent years? Two important reasons are behind this unrealistically high target. The first one is related to the choice of the reference period. 2003-2007, the period chosen due to data constraints, was a bully period for world trade, just after the 2001-02 trough and just before the 2008-09 fall. By any standard, this is not a suitable benchmark for a long-term analysis. 1985-2007 is clearly preferable in this respect, and Figure 1 left-hand panel shows the difference it makes: the model then leaves approximately 2 p.p. unexplained, out of a slowdown worth less than 6 p.p. The second reason has to do with the definition of the slow growth puzzle. Nobody denies the fact that slower GDP growth leads to slower trade growth, so the puzzle is not that trade has slowed down, but rather that it slowed down more strongly than GDP did. In other words, what needs to be explained is not the growth in world trade in absolute, but rather relative to GDP. Simple calculations based on the WEO database allow assessing the joint implications of these two remarks (Table 1): using the 2003-07 period as a benchmark and trade growth as the variable of interest, the slowdown is 5.8 p.p. (slightly less than in the IMF model, presumably due to sampling differences); using instead the 1985-2007 period and focusing on the differential growth rate of trade with respect to GDP, the slowdown is reduced to 3.0 p.p. This is still large, but provides a different perspective: the 2 p.p. unpredicted world trade slowdown in IMF estimates are not a quarter anymore, but rather two-thirds of the puzzle. Explaining a third of the slowdown is not that bad already, but might warrant more humble conclusions -in line, by the way, with the fact that all but one of the twice-yearly IMF forecasts of world trade volume proved overestimated since 2011, often by a large amount.
The IMF interpretation more specifically points to the role of investment, a relatively import-intensive component of demand. In particular, it emphasizes that “the sharper slowdown of trade in capital and durable consumption goods (…), which is a large part of investment expenditures, points to the potential role of investment weakness in holding back global trade growth in recent years” (IMF 2016, p. 69). This argument is best illustrated by the report’s Figure 2.4, Panel 4 (p. 70, reproduced below as Figure 2). Two remarks are in order here. Firstly, trade in capital goods was actually the most dynamic component of world trade over the recent period. It is thus paradoxical to point out its role in order to explain the slowdown, even though more sustained growth might certainly have been expected for this component. Secondly, as already mentioned, the 2003-2007 period is not representative because it is clearly an above-trend short spell. This is especially clear here, since the average yearly growth rate of world trade in volume was 14% for capital goods over that period –meaning approximately a doubling every five years. Is this really a sustainable trend, which can be meaningfully used as a benchmark? I doubt it.
So, what was really the role of investment weakness in the recent trade slowdown? Being more import intensive than other components of demand, investment might indeed drive down world trade growth as long as its growth rate is lower than the one of other demand components. Put differently, this may be the case when the share of investment in GDP is declining –whatever its level. Was it the case over the recent years? Based on the WEO database and focusing on top exporters, the picture is not clearcut (Figure 3): the decline in investment was clear in China (as expected from the on-going rebalancing process), it was also significant in Korea (also starting from a very high level in this country), and Russia shared this trend in 2015 as a result of its economic crisis. Other countries, in contrast, did not experience a downward trend in investment as a share of GDP since 2011. This does not mean that investment level is satisfactory: on the contrary, it did not recover its pre-crisis level in any of these big countries, a fact that is a major concern for growth and the root of the secular stagnation debate. While investment level is low, though, its growth rate in recent years has been more or less on a par with other demand components. In this rebound phase, investment should be more dynamic and act as a booster of trade. However, arithmetically, as long as it does not grow significantly less rapidly than the rest of demand, investment cannot be an important explanation for the recent trade slowdown (notwithstanding the fact that it was clearly one of the main explanations for the sharp fall of trade during the crisis, in 2009).
Two conclusions follow. Firstly, the IMF assessment overemphasizes the role of weak demand, and in particular investment, in explaining the trade slowdown. Of course, slower GDP growth command slower trade growth, this mechanical relationship cannot explain recent trends. The flipside is that the IMF assessment probably understates the importance of the other main factors, put forward in several other studies: the rebalancing of the Chinese economy, the declining dynamism in GVC participation, and the spread of protectionist policies (see, e.g., Constantinescu et al. 2016, Crozet et al. 2015, Haugh et al. 2016, or Evenett and Fritz, 2016). Secondly, the estimates presented barely explain a third of the world trade slowdown. This should humble us about how well we understand on-going trends, and our humility in this respect should be reinforced by the most recent figures: as mentioned by the IMF, high-frequency data assembled by the Netherlands CPB suggest that world trade in volume actually stagnated, or better said slightly declined, since early 2015. Decidedly, there is more to world trade’s recent trends than weak demand and investment.
|
Figure 1 : Main results of the IMF import demand model
|
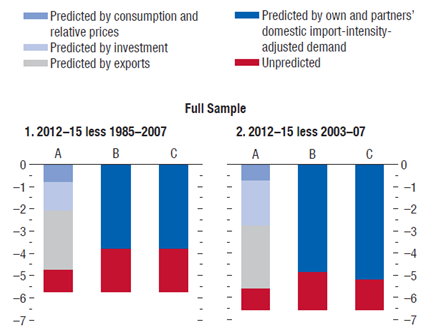 |
| Source: Figure 2.7 (“Empirical Model: Decomposing the Slowdown in Real Goods Import Growth”), p. 73, IMF 2016. Column A includes exports among explanatory variables, only columns B and C are presented as full decompositions of the world trade slowdown (see IMF 2016, p. 74). |
|
Table 1: How large is the slow-trade puzzle?
|
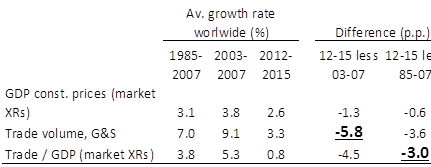 |
| Source: Calculations based on the October 2016 WEO database (IMF), using world-level growth rates as computed by the IMF. For each period, the average growth rate is computed as the simple mean of yearly growth rates (excluding the first year). |
|
Figure 2: Trade Dynamics across Types of Trade and Products
|
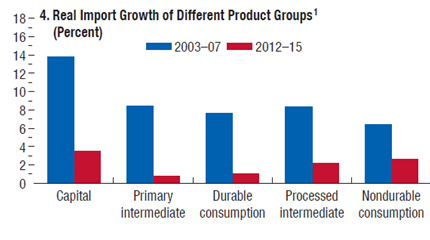 |
| Source: Figure 2.4 (Panel 4), p. 70, IMF 2016. |
|
Figure 3: Investment is low, but recent changes as a share of GDP are mixed (investment as a share of GDP in % in the world top-8 exporters)
|
 |
|
Source: Calculations based on the October 2016 WEO database (IMF). |
References:
Constantinescu, C.; Mattoo, A. & Ruta, M. (2015), 'The Global Trade Slowdown: Cyclical or Structural?' IMF Working Paper 15/6.
Crozet, M.; Emlinger, C. & Jean, S. (2015), “On the gravity of the trade slowdown”, in Hoekman, B., ed., The Global Trade Slowdown: A New Normal?, VoxEU and CEPR, pp. 179-196.
Evenett, S. J. & Fritz, J. (2016), Global Trade Plateaus, The 19th Global Trade Alert Report, CEPR and Global Trade Alert.
Haugh, D.; Kopoin, A.; Rusticelli, E.; Turner, D. & Dutu, R. (2016), 'Cardiac Arrest or Dizzy Spell: Why is World Trade So Weak and What can Policy Do About It? OECD Economic Policy Paper 16, OECD.
IMF (2016), “Global Trade: What’s behind the Slowdown?”, Chapter 2, in World Economic Outlook, October 2016, IMF.
< Back
